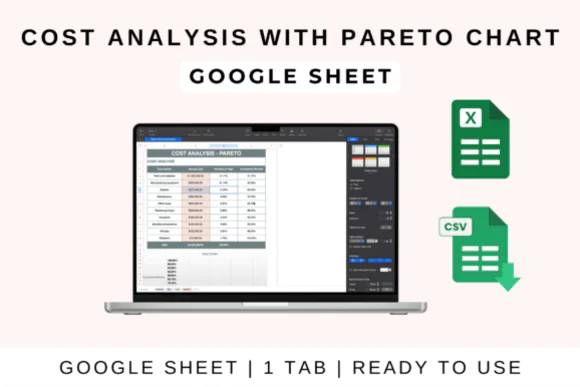

Identify your biggest cost drivers and make smarter financial decisions with this Cost Analysis with Pareto Chart Template. This professional spreadsheet is designed to help businesses, teams, managers, analysts, and individuals analyze expenses using the powerful 80/20 Pareto principle, making it easier to see which cost categories have the greatest impact on overall spending.
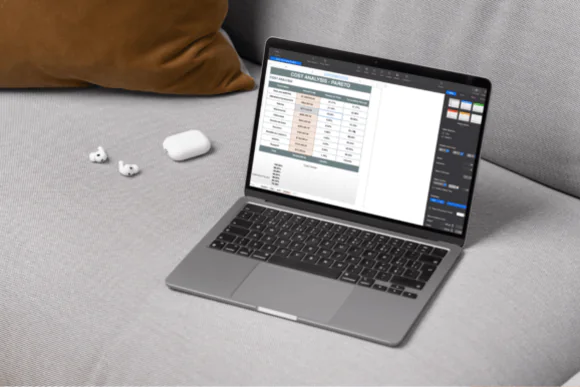
With this template, you can categorize costs, enter expense data, analyze spending patterns, and automatically generate a Pareto chart that visually highlights the most significant cost contributors. Instead of guessing where your money is going, this spreadsheet helps you quickly identify the areas that deserve the most attention for budgeting, cost control, and financial improvement.
The built-in formulas, visual indicators, and chart-based layout make cost analysis simple and practical. Whether you are reviewing business expenses, project costs, operational spending, department budgets, manufacturing costs, or personal finances, this template gives you a clear structure to understand priorities and take action. It is fully compatible with Google Sheets, Microsoft Excel, and Apple Numbers, making it flexible and easy to customize for different financial analysis needs.
What You Can Do With This Template
Perfect For
Business cost analysis, expense management, project budgeting, operations planning, financial reviews, department budget tracking, manufacturing cost control, small business finance, cost reduction planning, spending analysis, and budget optimization.
Published:
Apr 27, 2026 07:34 AM
Category:
Tags: