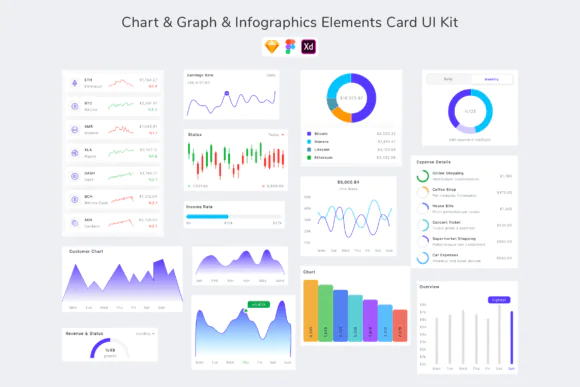
Transform complex data into engaging visual stories with this professional Chart & Graph Infographics Elements UI Kit. Designed for modern digital products, dashboards, business presentations, analytics platforms, and data-driven applications, this comprehensive collection provides beautifully crafted infographic components that help designers create impactful visualizations quickly and efficiently.
Built with current UI/UX trends in mind, this versatile kit includes a wide range of charts, graphs, statistical widgets, and infographic elements suitable for websites, mobile applications, SaaS dashboards, business intelligence platforms, marketing reports, financial analytics, and corporate presentations.
Whether you're creating KPI dashboards, performance reports, financial summaries, marketing analytics, or data visualization projects, these pixel-perfect components allow you to build professional interfaces without starting from scratch. Every element is fully editable and organized for seamless customization.
Key Features:
Perfect For:
Create visually compelling reports and dashboards that communicate data clearly while maintaining a polished, professional appearance. This infographic UI kit saves valuable design time and helps you deliver high-quality results faster.
Published:
Jun 02, 2026 10:09 AM
Category:
Tags: